


5.0

"APPWRK IT Solutions Private Limited has demonstrated high confidence in their commitment..."


Consumer Packed Goods
 React JS
 .NET Core
 BlueYonder Integration
 REST-API
 ApexCharts
 Microsoft Azure
 Azure Services
Unilever, one of the world’s largest FMCG enterprises, operates a geographically dispersed network of factories, warehouses, and logistics operations that generate large volumes of operational data. As the organization scaled across regions and sites, achieving enterprise-wide visibility across core operations, like inventory management, logistics, warehouse, and yard management, became increasingly challenging due to decentralized reporting.
While operational systems produced rich data, inconsistent KPIs, static site-specific dashboards, and repeated IT involvement created friction in analysis and delayed decision-making. Limited cross-location comparability and fragmented reporting reduced confidence in enterprise-level performance insights.
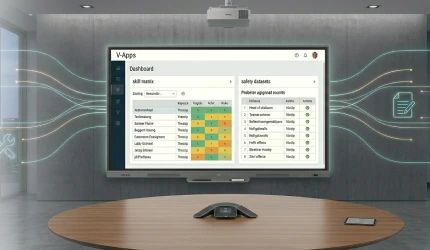
In a strategic partnership with APPWRK, Unilever developed ByDashboards, a next-generation Enterprise Analytics and Business Intelligence Platform designed to centralize analytics and significantly reduce data analysis friction. The platform enables fully customizable, self-service dashboards where users can select sites, define KPIs, choose visualization formats, and instantly generate performance views without IT dependency.
Integrated directly with operational warehouse systems and built on a unified enterprise database, ByDashboards established a single source of truth for analytics and reporting. This shift enabled a move from rigid, tool-driven reporting to a flexible, business-led analytics model, improving data reliability, accelerating decision-making, and ensuring consistent KPI governance across factories, warehouses, and regions.
The absence of a unified analytics backbone led to fragmented reporting across factories, warehouses, and logistics operations, creating system dependencies, limiting enterprise-wide visibility, and preventing connected factory insights and cross-site benchmarking.
Inconsistent KPI definitions, decentralized reporting practices, and localized analytics setups resulted in data integrity issues, reduced confidence in reported metrics, and negatively impacted leadership-level decision-making.
Operational data flowing from systems such as WMS through multiple handoffs introduced latency, duplication, and integration friction, weakening interoperability between edge systems, cloud platforms, enterprise analytics layers, and downstream reporting consumers.
Changes to KPIs, dashboards, or reporting structures required multiple coordination steps across teams, increasing turnaround time for analytics updates and slowing response to evolving operational requirements.
Rigid, tool-driven reporting architectures constrained the scalability of analytics pipelines, limited the adaptability of dashboards to evolving business needs, and hindered rapid rollout across new sites and operational environments.
Changes to KPIs, dashboards, or reporting structures required extensive cross-team coordination, increasing turnaround times, slowing responsiveness to operational needs, and constraining engineering throughput due to manual rework and repeated customization efforts.
APPWRK implemented ByDashboards as a single enterprise analytics backbone, consolidating reporting across factories, warehouses, and logistics into a consistent, scalable platform.
ByDashboards enabled connected factory and warehouse visibility by allowing users to select sites dynamically and visualize standardized KPIs across locations. This supported cross-site benchmarking, operational comparisons, and consolidated performance views without localized reporting setups.
The platform introduced a governed KPI framework with centralized definitions, ensuring manufacturing and operations data integrity while allowing controlled flexibility for site-level analytics. This improved confidence in reported metrics and enabled consistent decision-making across leadership and operational teams.
ByDashboards integrated directly with operational systems such as the Blue Yonder Warehouse Management System and operated on a unified enterprise database. This streamlined data flow from edge systems to cloud and enterprise layers, reducing latency, duplication, and integration friction.
The solution delivered real-time, configurable dashboards allowing business users to modify sites, KPIs, and visualizations without engineering intervention.
APPWRK built an API-driven, metadata-based architecture to support interoperability, rapid onboarding of new sites, and extensible analytics pipelines.
The implementation of a unified analytics backbone significantly reduced data friction between operational systems, analytics layers, and reporting consumers, enabling smoother data flow and more reliable insights.
Self-service dashboard configuration and governed KPI selection reduced turnaround time for analytics updates, allowing business teams to respond faster to operational changes without extended coordination cycles.
Centralized KPI definitions and standardized performance models improved data integrity and ensured consistent measurement across factories, warehouses, and logistics operations.
Leadership and operational teams gained connected, cross-site visibility into performance metrics, supporting benchmarking, comparative analysis, and more informed decision-making across regions.
The platform enabled rapid onboarding of new factories and warehouses into the analytics ecosystem, supporting scalable adoption without re-architecting reporting pipelines. By moving analytics configuration to a platform-driven model, engineering teams reduced repetitive customization work and increased throughput for higher-value platform enhancements.

 April 14, 2026
A unified SaaS insurance platform that centralizes claims, policy management, and analytics to streamline end-to-end insurance operations.
 January 7, 2026
A centralized digital platform enabling Unilever to standardize frontline training, certification, and compliance across global manufacturing operations.
 January 7, 2026
A unified logistics, supply chain, and transportation management platform built to power enterprise-scale freight operations across multiple brands and partners.
 January 6, 2026
A scalable dual-panel social commerce super app that unifies content discovery, marketplace transactions, payments, and logistics into a single platform.
 December 29, 2025
Built a scalable cloud-based file upload, processing, and delivery platform to improve reliability, performance, and operational resilience for high-volume application workloads.
 June 25, 2026
Risen Hope is a digital Bible study and discipleship platform built to serve studies, events, donations, and giving across web & mobile.
 June 14, 2026
DocuGuardian extended its secure document platform so organizations can onboard and manage their own clients on a hardened AWS foundation.
 April 22, 2026
A multi-tenant SaaS platform centralizing workforce, resource, and cross-organization operations with governed access control and lifecycle management.
 April 22, 2026
An AI-powered career enablement platform delivering ATS-optimized resumes, personalized job discovery, and skill gap insights within a unified candidate experience.
 April 17, 2026
A fully integrated Inventory Management System that consolidated all channel operations into a single centrally governed platform.
 April 15, 2026
A fully integrated, scalable commerce platform enabling dynamic product content, subscription revenue and seamless wholesale operations for a growing D2C health brand.
 January 5, 2026
AI-powered, multi-modal conversational sales assistant transforming digital product discovery and assisted selling for a leading consumer appliance brand.
 December 31, 2025
Engineering an enterprise-grade, developer-first charting and data visualization SDK used to embed high-performance interactive charts across products and applications.

 December 26, 2025
Transforming Technical Hiring Through Dynamic Interviews, Real-Time Evaluation, and Automated Candidate Scoring.
 December 25, 2025
An AI-powered trading platform enabling intelligent strategy creation, automated execution, and real-time performance insights for modern digital traders.
 December 11, 2025
A scalable digital experience platform enabling Sportskeeda to deliver high-performance content, real-time engagement, and seamless user journeys across global audiences.
 December 10, 2025
An AI-powered conversational agent that enables intelligent, context-aware customer interactions through natural language understanding, real-time responses, and seamless multi-channel integration.

Odds and Ends Supply LLC
Appwrk delivered exactly what we needed a custom Shopify app built with speed, precision, and deep expertise. As a non-technical founder, I especially appreciated how their team guided me through every step and handled all complexities seamlessly. Highly responsive, reliable, and great to work with. I’d strongly recommend them for any Shopify development needs.

ICT Specialist
The communication with the web development team has been great. They respond quickly.

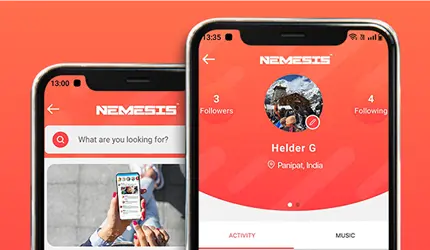
Founder & CEO, Nemesis
The team is very good, very efficient, and they leave me good review videos of the work they’ve done, and they help out a whole lot.

Director, PlusDigital
The product is still under development, but the client has been pleased with APPWRK IT Solutions’ efforts. The team communicates daily and responds quickly via Skype or email. Their high level of professionalism allows them to produce quality work. They’ve also impressed with their coding skills.

Owner, ECONESS Store
APPWRK IT Solutions Private Limited consistently delivers work on time and promptly addresses concerns, requests, and feedback.
Kargo
The company is satisfied with APPWRK IT Solutions Private Limited’s provided engineers. Most of the team was highly communicative and helpful throughout the partnership. Overall, their ability to supply developers across South East Asia stands out.

"APPWRK IT Solutions Private Limited has demonstrated high confidence in their commitment..."
"The team at APPWRK was proactive, transparent, and truly professional."
"They exceeded our expectations — on time, on budget, and with creativity!"
No empty sales pitches, just practical solutions
tailored to your business.
Let us know so we can improve the quality of the content on our pages